
ForceDecks for Runners: Getting the Data Right

Tanner Nyholm, Physiotherapist - Move Sports Physio Geelong
Force plate testing has moved out of university biomechanics labs and into everyday sports clinics, offering advanced sports performance testing to the curious athlete or everyday runner.
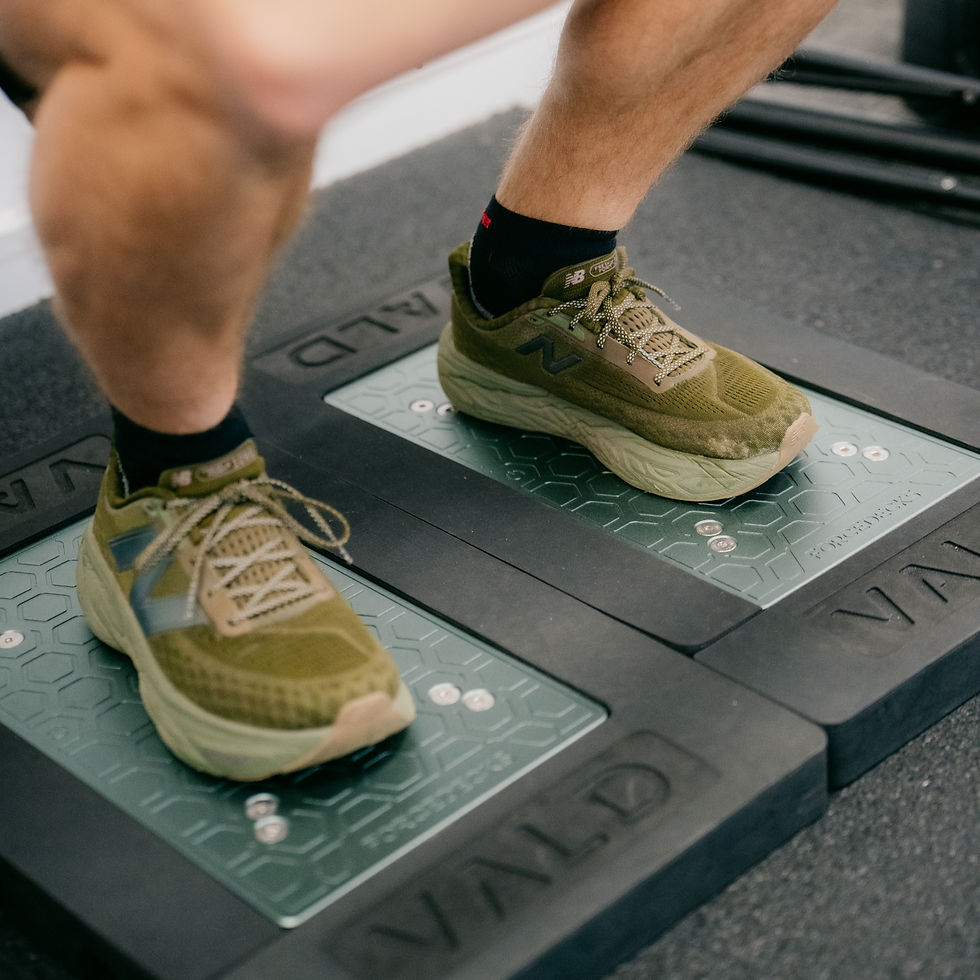
At Move, we use VALD Performance's ForceDecks dual force plate system to look under the hood of a runner's neuromuscular performance: how much force they produce, how quickly, how evenly between legs, and how that changes as training load builds or injury recovery progresses.
But here's the part that doesn't get talked about enough: a force plate is only as useful as the data quality behind it. Jump on a ForceDecks a few different ways, on a few different days, in a few different moods, and you can generate numbers that look precise but tell you very little. Getting genuinely useful, decision-grade data and turning that data into real performance gains takes a clinician who knows what the numbers are (and aren't) telling them.
This blog walks through both halves: how we get the data right, and how we use it to actually influence performance and return-to-run outcomes.
What ForceDecks Actually Measures
At its core, a force plate measures two things: force and time. From that raw force-time signal, ForceDecks derives dozens of metrics across jump, balance and isometric strength tests — jump height, rate of force development, eccentric and concentric impulse, reactive strength index (RSI), and inter-limb asymmetry, among others. Independent validation testing has compared ForceDecks against gold-standard laboratory force plates and found the system records ground reaction force and centre of pressure with high accuracy, with the majority of commonly used metrics showing good-to-excellent validity and test-retest reliability when standardised protocols are followed (Bourne et al., 2024, Journal of Science and Medicine in Sport).
The Problem: Data That Looks Precise Isn't Automatically Meaningful
Force plates output numbers to two decimal places, which can create a false sense of certainty. In reality, several factors can quietly distort a runner's results before a single training decision is made off the back of them:
Inconsistent setup — different footwear, arm position, or starting stance between sessions changes the movement strategy being tested, not just the outcome.
Fatigue and time of day — a countermovement jump (CMJ) done after a hard track session or late in the evening won't reflect the same neuromuscular state as one done fresh in the morning.
Unfamiliarity effects — first-time test scores are often lower simply because the athlete hasn't learned the movement pattern yet, not because their physical qualities have changed.
Poor trial selection — a mistimed jump, a foot that clips the edge of the plate, or a single-leg test where the other foot touches down early will contaminate the result if it isn't screened out.
Over-interpreting asymmetry scores — asymmetry between limbs can be calculated several different ways, and the method used changes the number you get. Researchers have described this as the "calculation conundrum": the same underlying data can yield meaningfully different asymmetry percentages depending on the formula applied, so a single asymmetry figure should never be read in isolation.
What this means is that the protocol around the technology is where reliability is won or lost.
How We Get the Data Right at Move
To make sure the numbers we collect are trustworthy enough to act on, we apply a few non-negotiables with every runner we test on ForceDecks:
1. Standardised protocols, every time - Same test order, same footwear instructions, same verbal cueing, same warm-up. VALD's own testing guidance emphasises following consistent protocols to capture high-quality, reliable data.
2. Familiarisation before we trust the numbers - Runners get a genuine practice attempt at unfamiliar tests before we record anything we intend to compare against future sessions.
3. Multiple trials, screened properly - We don't take the first jump and move on. We look at the raw force-time curve for each trial and discard anything that doesn't meet the test criteria (foot placement, contralateral limb contact, movement strategy) rather than accepting whatever number the software auto-detects.
4. Consistent testing conditions over time - For runners we're monitoring through a training block or a return-to-run program, we aim to test at a similar time of day, similar point in the training week, and similar fatigue state.
5. Context before conclusions - We interpret every metric against the runner's history, symptoms, training load and normative reference data before drawing any conclusions.
Turning Data Into Real Performance Results
Once we trust the data, the value shifts from "interesting numbers" to genuine clinical and performance decision-making. A few of the ways this plays out for runners:
Reactive strength and the stretch-shortening cycle - Running is a repetitive stretch-shortening cycle activity, and RSI (jump height divided by contact time on a drop jump) is one way to quantify how efficiently a runner's calf-Achilles-foot complex stores and returns elastic energy.
It's worth noting the research here is genuinely mixed, Some studies link higher reactive strength and eccentric leg strength to better running economy, while others find no significant relationship, particularly at faster paces. We treat RSI as one useful piece of the neuromuscular picture for a runner, not a standalone predictor of race performance.
Asymmetry as a flag, not a verdict - Force plate asymmetry between limbs can highlight a constraint in context. For example; reduced eccentric deceleration capacity on the side of a previous calf or hamstring injury is worth investigating further. Compared to; looking for something to "fix" purely because a number is uneven. Because asymmetry calculations are sensitive to method, we track direction and trend over repeated, standardised tests rather than reacting to one session's figure.
Objective return-to-run decisions - Pain-free walking or a clean gait doesn't guarantee a runner's tissue can tolerate the eccentric and reactive demands of running again. Comparing force, power and asymmetry metrics against the runner's own baseline (or against age- and sport-matched normative data) gives us an evidence-informed checkpoint before progressing load, rather than relying on time-based rehab timelines alone.
Tracking readiness and training response - Because ForceDecks testing is quick and non-fatiguing, we can repeat key tests through a training block to see whether a runner is adapting as expected, or whether force and power output are trending down in a way that may suggest poor recovery or under-fueling.
The Bottom Line
ForceDecks open a window into a runner's neuromuscular performance, but the technology doesn't do the thinking for us. The value is in the discipline of the testing process and the clinical reasoning applied afterwards: standardised, repeatable protocols that produce trustworthy data, and a physio who interprets that data in the context of the individual runner in front of them, not just the number on the screen.

Got you curious?
Whether you're chasing a PB, returning from injury, or simply want to test objective baselines. We now offer comprehensive running assessment packages that includes movement analysis, ForceDecks assessment and data interpretation, hands on care, training protocols and more.
References
Bourne, M. N. et al. (2024). Concurrent validity and test–retest reliability of VALD ForceDecks' strength, balance, and movement assessment tests. Journal of Science and Medicine in Sport, 27(8), 572–580.
Bishop, C., discussed in "Measuring Athlete Asymmetries: The Calculation Conundrum," Global Performance Insights.
VALD Performance, "Testing with ForceDecks" protocol guidance, VALD Support/Knowledge Base.
Blagrove, R. C. et al. (2019). Correlation of Eccentric Strength, Reactive Strength, and Leg Stiffness With Running Economy in Well-Trained Distance Runners. Journal of Strength and Conditioning Research (via PubMed).
Reactive Strength Index as a Key Performance Indicator in Different Athlete Populations – A Systematic Review, Science & Sports (ScienceDirect).


